HERMES + PLAYWRIGHT
WeChat, SigStick & Giphy
Method: Hermes Agent + Playwright
A Hermes agent runs a daily cron job with Playwright scripts to automatically collect WeChat, SigStick, and Giphy stats.
SourceMulti-Platform Channels
Automated daily data collection pipeline consolidating Hermes Playwright cron jobs, Tavily API, a scheduled Telegram bot, and Google Analytics into ONE central spreadsheet and exportable stats hub
Hermes Playwright cron agents, Tavily, Telegram bots, and GA piped into a real-time intelligence sheet.
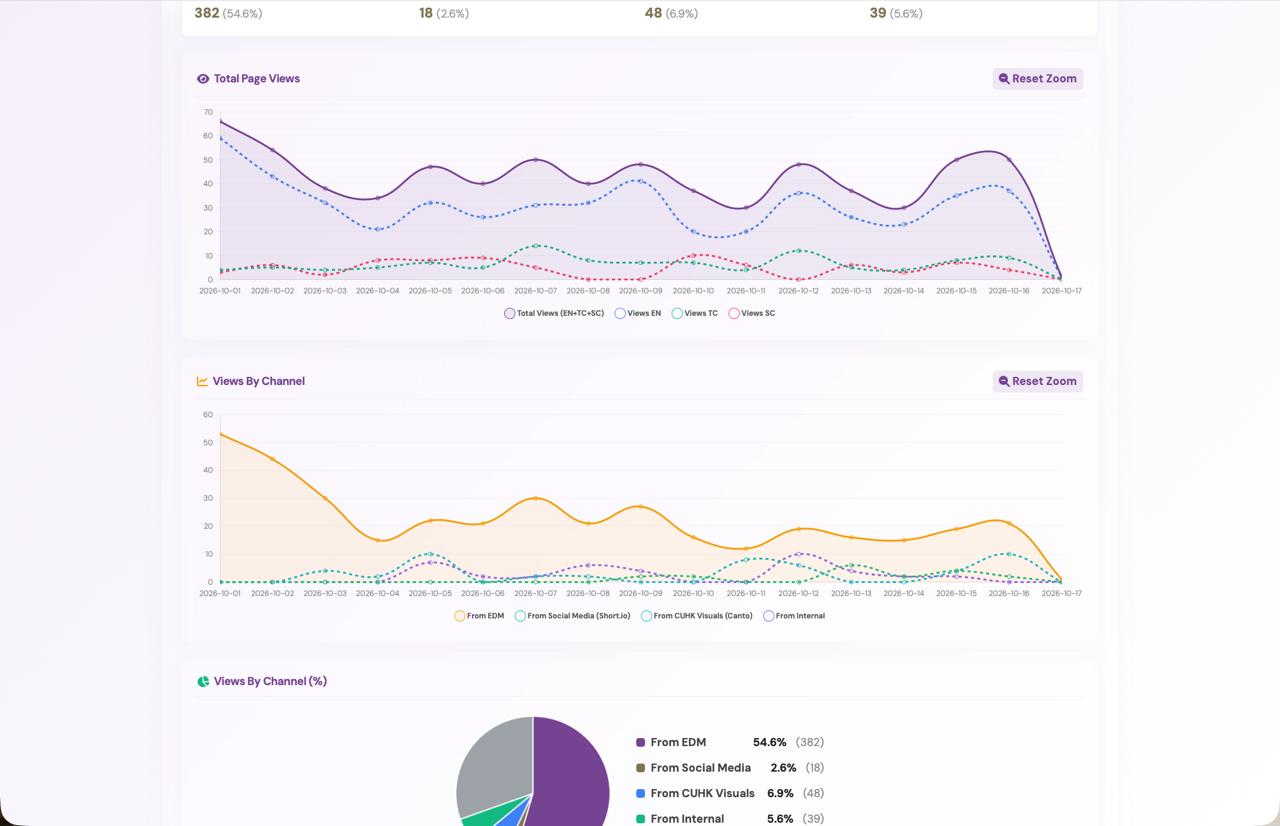
All data arrives automatically in ONE spreadsheet daily, powering the stats hub webpage and easy PDF export.
Hermes Playwright cron, Tavily API, Telegram bot, and Google Analytics automatically consolidate into ONE central spreadsheet daily with zero manual entry.
Tracking statistics across WeChat, SigStick, Giphy, WhatSticker, Telegram, and websites required checking incompatible interfaces with no centralized database.
Built an automated daily pipeline where a Hermes agent (cron + Playwright), Tavily API, a scheduled Telegram bot, and Google Analytics consolidate data into ONE central spreadsheet, powering a live stats hub and PDF exports.
CASE STUDY ROLE: SYSTEM DESIGN & AUTOMATION PIPELINE
The system automates daily data collection across multiple channels with zero manual data entry.
Each day, an autonomous Hermes agent executes a scheduled cron job using Playwright headless scripts to scrape metrics from WeChat, SigStick, and Giphy. Concurrently, an automated Tavily API call queries WhatSticker stats, a Telegram bot runs on a schedule executing a script to gather Telegram statistics, and Google Analytics provides website traffic data.
All of this incoming data lands automatically into ONE single spreadsheet that serves as the centralized database. Once the spreadsheet updates daily, the stats hub webpage immediately reflects the latest data with interactive filtering and selectable time ranges, and a clean PDF report can be exported with one click.
Method: Hermes Agent + Playwright
A Hermes agent runs a daily cron job with Playwright scripts to automatically collect WeChat, SigStick, and Giphy stats.
Method: Tavily API Call
An automated Tavily API call queries and extracts WhatSticker statistics directly without manual lookup.
Method: Scheduled Telegram Bot
A Telegram bot runs automatically on a schedule and runs a dedicated script to collect Telegram stats.
Method: Google Analytics
Google Analytics automatically provides website traffic data and visitor telemetry on a daily schedule.
Method: One Google Spreadsheet
All collection channels land daily in that ONE spreadsheet, acting as the centralized database for the hub.
Method: Web Dashboard & PDF Export
Once the spreadsheet updates, the stats hub webpage reflects new data, allowing instant PDF report export.
Consolidates all metrics from external channels and web traffic into a single unified view powered by the central spreadsheet.
Multi-dimensional filters let users slice data across channels, platforms, and sticker packs simultaneously.
Dynamic time pickers enable quick comparison across campaign launch windows, weeks, or custom date spans.
Granular drill-downs provide detailed performance analytics for each individual sticker and pack.
Generates clean, report-formatted PDF documents directly from the stats hub webpage with one click.
Hermes agent runs Playwright cron jobs (WeChat, SigStick, Giphy), Tavily API collects WhatSticker, and scheduled Telegram bot runs scripts.
Google Analytics provides website traffic data to join the automated daily ingestion stream.
All data streams land automatically into ONE central spreadsheet serving as the centralized database.
The stats hub webpage instantly reflects the updated spreadsheet data, ready for browsing and one-click PDF export.